Barometric Pressure Experiments offer a hands‑on way to explore the invisible forces that shape our weather. By building simple instruments and recording data, you can witness how atmospheric pressure changes with altitude, temperature, and weather fronts. Whether you’re a student, a hobbyist, or a curious parent, these experiments bring the science of meteorology into your living room.
Understanding Barometric Pressure Experiments
Barometric pressure, also known as atmospheric pressure, is the weight of the air above us. It influences everything from the flight of birds to the rise of a storm. In a Barometric Pressure Experiment, you measure this pressure with a homemade gauge and observe how it fluctuates over time. The primary goal is to connect the dots between pressure readings and weather patterns, giving you a tangible feel for the science behind weather forecasting.
Materials for DIY Barometric Pressure Experiments
Gathering the right tools is the first step. Below is a concise list of items that will help you construct a reliable barometer and record your data accurately.
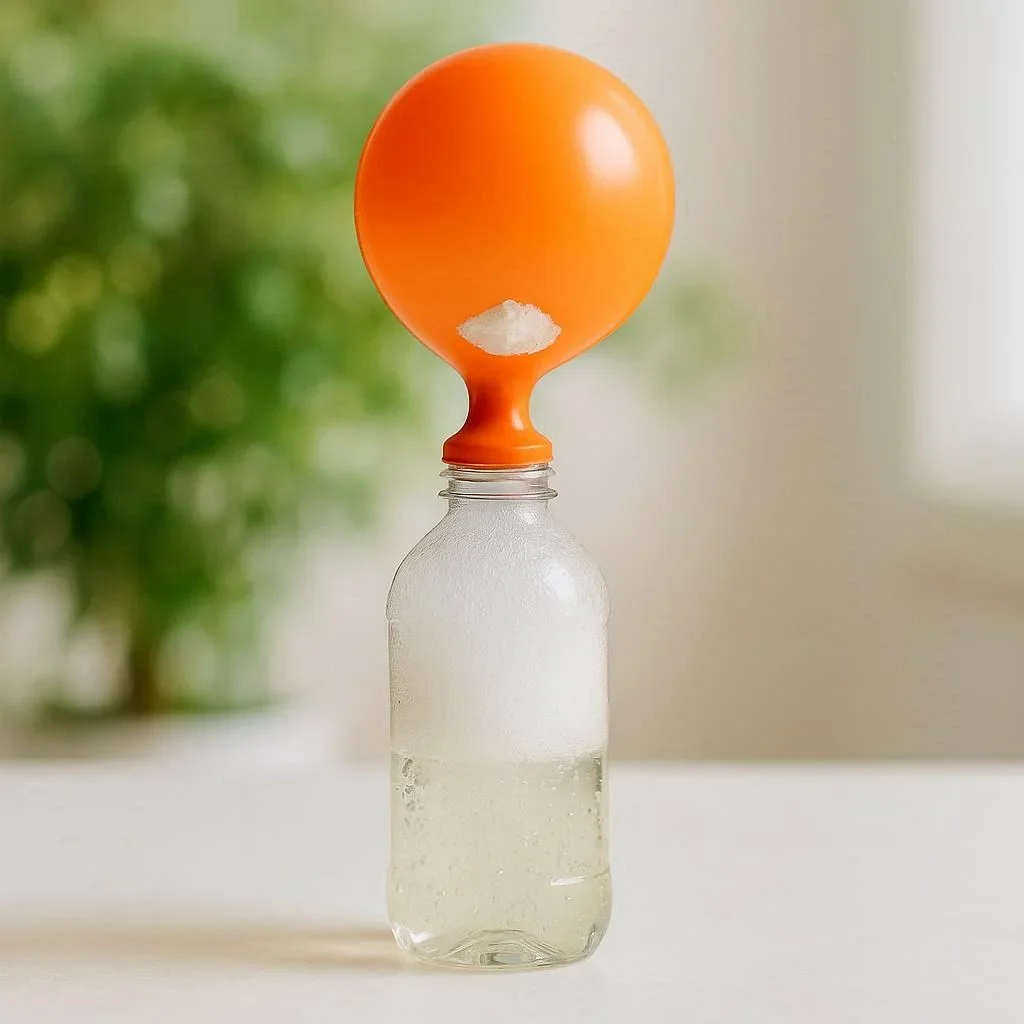
- Clear plastic bottle (1‑liter size works well)
- Balloon or flexible rubber sheet
- Rubber band or adhesive tape
- Thin metal rod or straw (about 10 cm long)
- Water or a small amount of liquid (optional for a water‑barometer variant)
- Scale or ruler (to measure displacement)
- Notebook or digital spreadsheet for logging data
- Internet access for reference and comparison with official data
These materials are inexpensive and widely available, making the experiment accessible to anyone with a basic science kit.
Step‑by‑Step Barometric Pressure Experiments
Follow these steps to build a simple barometer and start collecting data. The procedure is straightforward, yet it yields insights that can be compared with professional meteorological data.
- Prepare the Bottle: Cut the top off the plastic bottle, leaving the bottom intact. This will serve as the pressure chamber.
- Seal the Opening: Stretch a balloon or rubber sheet over the bottle’s mouth and secure it with a rubber band or tape. The seal must be airtight to allow pressure changes to affect the balloon’s shape.
- Insert the Rod: Push the metal rod or straw through the sealed opening so that it extends into the bottle. The rod should be free to move up and down inside the bottle.
- Mark the Scale: Place a ruler or scale next to the rod. Mark the initial position of the rod’s tip as your baseline.
- Record Baseline Pressure: Note the initial reading in your notebook. This will be your reference point for future changes.
- Observe Over Time: Check the rod’s position at regular intervals (e.g., every hour). Record the displacement and note any weather changes you observe outside.
- Compare with Official Data: Use online resources such as NOAA Barometric Pressure or Wikipedia Barometer to compare your readings with official atmospheric pressure values.
- Analyze Trends: Look for patterns—does the rod rise before a storm? Does it fall during a heatwave? These observations help you understand the relationship between pressure and weather.
By repeating this experiment over days or weeks, you’ll build a dataset that mirrors the data collected by professional meteorologists.
Analyzing Results from Barometric Pressure Experiments
Once you have collected data, the next step is analysis. Here’s how to interpret your findings:
- Plot the Data: Create a graph of rod displacement versus time. This visual representation makes trends easier to spot.
- Correlate with Weather Events: Cross‑reference your graph with local weather reports. Notice how pressure drops often precede rain or storms.
- Calculate Pressure Change Rate: Determine how quickly pressure changes (e.g., millibars per hour). This metric is used by meteorologists to predict rapid weather shifts.
- Validate with Scientific Sources: Compare your results with authoritative studies from institutions like NASA Atmospheric Science or MIT Meteorology. Consistency strengthens the credibility of your experiment.
Through this analysis, you’ll gain a deeper appreciation for how atmospheric pressure drives weather patterns and how small changes can signal significant events.
Extending Your Barometric Pressure Experiments
Once you master the basic setup, consider adding complexity to your experiments:
- Use a digital pressure sensor and microcontroller (e.g., Arduino) for automated data logging.
- Build a water‑barometer variant to visualize pressure changes with a liquid column.
- Combine your barometer with a temperature sensor to study the pressure‑temperature relationship.
- Share your data with online communities or local weather stations to contribute to citizen science projects.
These extensions not only deepen your understanding but also connect you with the broader scientific community.
Conclusion: Start Your Own Barometric Pressure Experiments Today
Barometric Pressure Experiments transform abstract meteorological concepts into tangible, observable phenomena. By building a simple barometer, recording data, and comparing your findings with professional sources, you become an active participant in weather science. Whether you’re teaching kids about the atmosphere, conducting a school project, or simply satisfying your curiosity, these experiments provide a reliable, hands‑on learning experience.
Take the first step—assemble your DIY barometer, start measuring, and unlock the secrets of the sky. Your Barometric Pressure Experiments await!
Frequently Asked Questions
Q1. What materials do I need to build a DIY barometer?
You’ll need a clear plastic bottle, a balloon or rubber sheet, a rubber band or tape, a thin metal rod or straw, a ruler, and a notebook or spreadsheet. Optional items include a small amount of water for a water‑barometer variant and a digital pressure sensor if you want to automate logging.
Q2. How does a homemade barometer work?
The balloon or rubber sheet seals the bottle’s mouth, allowing atmospheric pressure to push against it. As pressure changes, the balloon expands or contracts, moving the rod inside the bottle. The rod’s displacement reflects the pressure change, which you can measure with a ruler.
Q3. How often should I record the rod’s position?
Recording every hour provides a good balance between detail and manageability. For more precise trends, you can log every 30 minutes or use a digital sensor to capture data continuously.
Q4. Can I compare my readings with official weather data?
Yes. Websites like NOAA or local weather stations provide barometric pressure values in millibars. Plotting your data alongside these values helps validate your experiment and spot real weather patterns.
Q5. What extensions can I add to my DIY barometer?
Consider adding a temperature sensor to study the pressure‑temperature relationship, using an Arduino for automated logging, or sharing your data with citizen science projects to contribute to broader meteorological research.